Visualizer: Tables and Charts Manager for WordPress is a powerful and easy to use plugin used to create, manage and embed interactive, responsive charts & tables into your WordPress posts and pages.
The plugin leverages the Google Visualization API, DataTables.net, and ChartJS libraries to deliver responsive and animated charts, graphs, and tables, ensuring excellent cross-browser compatibility and a seamless mobile experience. You can fully customize all aspects of the charts and tables to suit your needs.
Why You’ll Love Visualizer
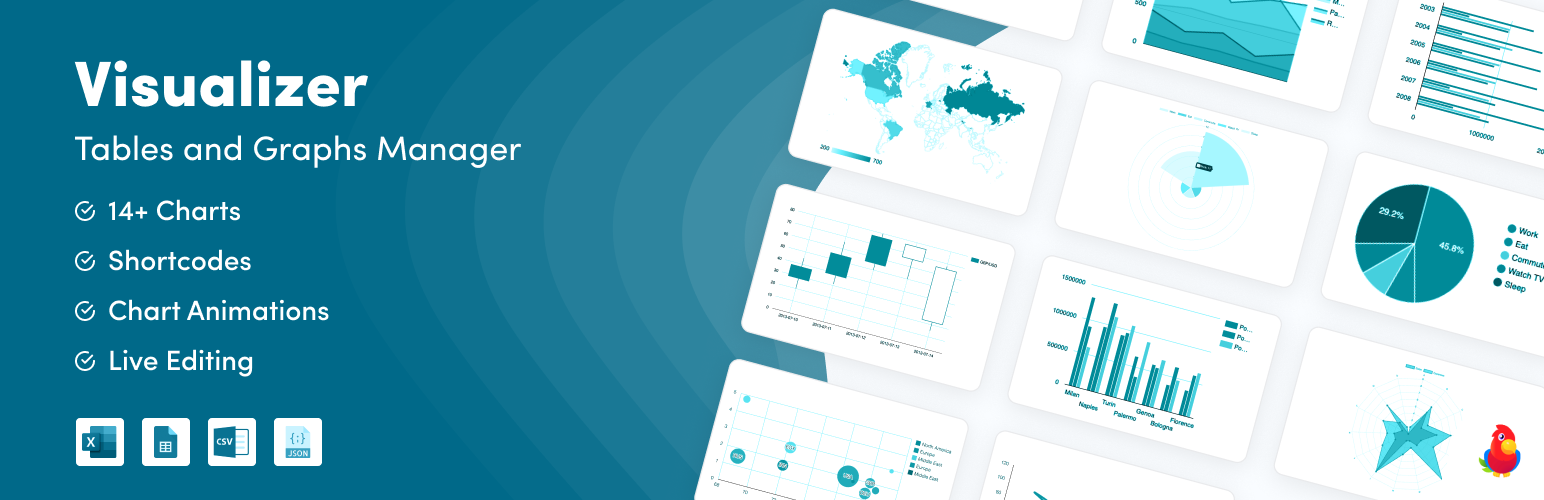
- Diverse Chart Options: Begin with essential chart types like line, pie, bar, and table in the free version. Elevate your data presentation with advanced chart types such as scatter, area, and geo available in the Pro version. The free version offers a comprehensive range of options that are perfect for various visualization needs.
- Manual Data Entry: Input data manually for quick visualization tasks. This method provides ultimate control over the content and structure of your charts, making it simple to tailor data presentation directly within the plugin interface.
- Ultimate Responsiveness: Crafted using HTML5/SVG technology, Visualizer charts ensure flawless functionality across all devices. This commitment to responsiveness guarantees that your data is not only accessible but also optimally displayed on desktops, tablets, and smartphones, enhancing user interaction and engagement.
- Data Table Capabilities: In addition to our responsive charts and graphs, you can also add responsive tables to your posts and pages and customize them to your liking. Visualizer Pro lets you enhance them with features such as sorting capabilities, pagination, and search functions. From pricing tables to product tables, the possibilities are vast and customizable to meet any data presentation need.
- Seamless Integration and Compatibility: Whether you’re using the Gutenberg editor or other page builders, Visualizer integrates effortlessly into your WordPress environment. This seamless compatibility allows for straightforward chart insertion and management.
- Flexible and Customizable: Make the charts and tables truly your own. Visualizer offers an extensive set of configuration options to perfectly match the look and feel of your website. Utilize Google Chart Tools with their default settings for simplicity, or dive into customization if your site’s style requires a unique approach. Every chart and table exposes numerous options that customize its appearance and functionality, ensuring your visualizations integrate seamlessly into your pages.
✨ YOU SHOULD USE VISUALIZER IF:
- You Own a Personal or Small Business Website: You need a straightforward, powerful tool to enhance your website’s visual appeal with interactive charts and tables. Visualizer makes complex data understandable and engaging.
- You Run an Educational or Financial Institution: For organizations that require regular reporting and data display, Visualizer offers comprehensive options for creating dynamic and informative charts and tables. This helps in better data analysis and presentation, aiding in decision-making and reporting.
- You Aim to Enhance SEO and User Engagement: Using Visualizer’s interactive and responsive charts can significantly improve user engagement, keeping visitors on your site longer, which can positively impact your SEO rankings.
- You are a Non-Profit Organizations: Non-profits can use Visualizer to display the impact of their initiatives through data. Create pie charts to show the distribution of spending or line charts to track donation trends over time, which can be powerful visuals for fundraising campaigns and annual reports.
- You are Financial Advisors and Economists: Visualizer allows for detailed financial reporting and economic analyses with advanced chart types like candlestick and radar charts. These tools can be used to depict stock performances, economic cycles, or budget allocations, providing clients with clear insights into financial matters.
- Regardless of Industry: With over 30,000 happy active users and 160+ 5-star ratings, Visualizer has been employed across a broad range of industries, including healthcare, marketing, education, and finance, demonstrating its versatility and effectiveness in any field.